ILLINOIS SOIL MOISTURE DATA
Papers written using the Illinois data taken from this Data
Bank must acknowledge the following paper:
Hollinger, S. E., and S. A. Isard, 1994: A soil moisture climatology
of Illinois. J. Climate, 7, 822-833.
1. DESCRIPTION OF THE DATA SET
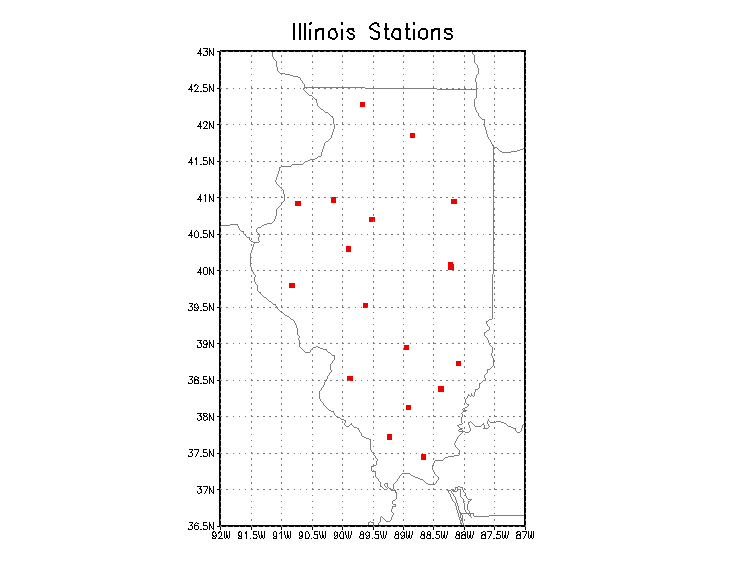
This data set consists of total soil moisture measured at 19 stations as part of
Water and Atmospheric Resources Monitoring
Program (WARM) in the state of Illinois, USA, from 1981 to June, 2004, measured
with the neutron probe technique, calibrated with gravimetric observations. The
data are measured for the top 10 cm of soil, and then for 20 cm layers
(e.g., 10-30 cm, 30-50 cm, ...) down to a depth of 2 m. The vegetation
at all stations is grass, except for one station with bare soil measurements,
at the same location as a grass-covered station. Please visit this link
to obtain detailed information about soil moisture monitoring in Illinois.
The data from the first three years of this data set
exhibit smaller variability than the rest of the data and should be used with
caution.
The data and details of the observations are described in the following
paper:
Hollinger, Steven E., and Scott A. Isard, 1994: A soil moisture
climatology of Illinois. J. Climate, 7, 822-833.
.
The data set is accompanied by ancillary information about field capacity
and wilting level. To obtain the data, please click below:
Map of the Illinois stations
List of the Illinois stations
2. ASCII TEXT FILES:
Illinois Soil Moisture Data
Illinois
Field Capacity (Plant- Available) Data
Illinois
Field Capacity (Total) and Soil Type Data
Illinois
Wilting Level Data
3. GrADS
TIME SERIES FILES:
Click the red square on the following map for plant available soil moisture time series at any of
the Illinois stations.

We have prepared the total soil moisture data for the top 1 m and 2 m in GrADS format,
following are the GrADS files which can be used to create a time series for any of the 19 stations.
GrADS control file,
GrADS script file and
Binary data
We also produced the plant available soil moisture, please click
here to access the files.
4. GrADS
STATION DATA FILES:
Previously in order to produce global maps and compare to climate model simulations, as well as
for studies of the scales of soil moisture variations. We processed the Illinois data to match the
general form of the Russian data, and the actual observations have
been adjusted to the 8th, 18th, and 28th of each month using the procedure described here,
thus all the data are in a standard form. However, when processing the updated data, we didn't adjust
the actual observations and kept them to the original date.
A sample figure: map of top 1 m total
soil moisture for Dec 17, 1991.
The above figure can be drawn by using the station data we created. All the necessary files (station data, control file
and script file) can be found
here. You can modify the script files to produce other maps and work with the data.
If you still want to use the old data, follow this link to find them.
For any questions about the data sets, please first contact Steven
Hollinger. For additional questions, you may contact
Jared
Entin.

Prepared by Alan Robock
(robock@envsci.rutgers.edu)
and Haibin Li (hli@envsci.rutgers.edu)
Last updated on August 30, 2004


![]()